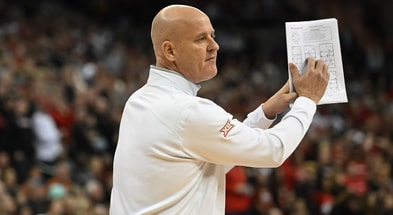
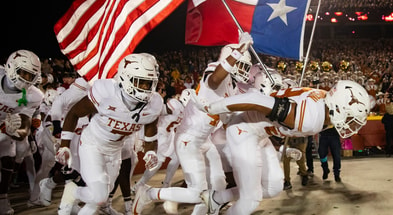
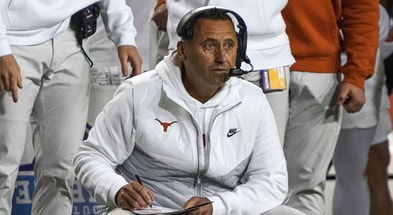
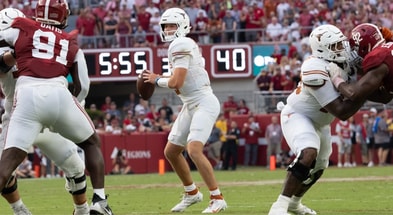
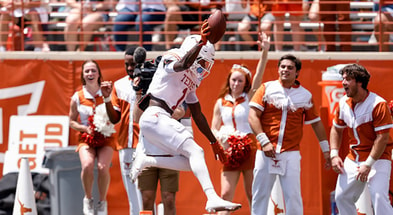
The 2022 Big 12 Offenses Analyzed
One of the merits of getting a full conference slate of results is that it allow apples to apples comparisons. Well, not quite apples to apples, but at least it’s apple to quince instead of apples to lasagna. Limited conference universes are not true apples to apples because Iowa State’s horrific offense never had to play its own league-leading defense. Don’t worry though, the Cyclones still managed miserable offensive stats without the indignity of being stuffed by their own defense.
[Get Inside Texas Plus until the start of the 2023 season for $10!]
Nonetheless, round robins provide very useful data because it throws out questionable non-conference opponents and forces like against like. It’s swell that Baylor dropped 69 on Albany while rolling up nearly 600 yards, but it’s utterly meaningless whether they scored 49 or 69. The extra 20 is just padding, like a college freshman who discovers her dorm’s unlimited meal plan.
So let’s make the data dance, add a little context, and see what we see. We’ll start big picture with scoring offense and then narrow our focus…
Offense
| Index | Team | G | TD | FG | XPT | 2XP | DXP | SAF | PTS | AVG/G |
|---|---|---|---|---|---|---|---|---|---|---|
| 1 | TCU | 10 | 49 | 15 | 44 | 1 | 0 | 0 | 385 | 38.5 |
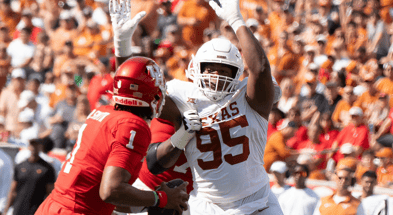
| 2 | Texas | 9 | 40 | 12 | 40 | 0 | 0 | 0 | 316 | 35.1 |
| 3 | Kansas State | 10 | 43 | 15 | 43 | 0 | 0 | 1 | 348 | 34.8 |
| 4 | Texas Tech | 9 | 35 | 16 | 31 | 2 | 0 | 0 | 293 | 32.6 |
| 5 | Baylor | 9 | 35 | 8 | 32 | 2 | 0 | 1 | 272 | 30.2 |
| 6 | Kansas | 9 | 37 | 5 | 34 | 0 | 0 | 0 | 271 | 30.1 |
| 7 | Oklahoma | 9 | 34 | 9 | 33 | 1 | 1 | 0 | 268 | 29.8 |
| 8 | West Virginia | 9 | 31 | 8 | 24 | 1 | 0 | 0 | 238 | 26.4 |
| 9 | Oklahoma State | 9 | 24 | 19 | 21 | 1 | 0 | 1 | 226 | 25.1 |
| 10 | Iowa State | 9 | 17 | 9 | 16 | 1 | 0 | 0 | 147 | 16.3 |
Forget all them fancy statistics, offense is just about points on the board! Right?
Well, sort of. The idea that an offense is solely responsible for scoring in football ignores the contributions of defense and special teams to the final numbers on the scoreboard. The 2009 Texas Longhorns scored non-offensive touchdowns by the bushel and set up the offense with countless short fields by forcing 37 turnovers (25 interceptions) along with safeties, pick sixes and lots of defensive mischief. Jordan Shipley, Marquise Goodwin and DJ Monroe also fueled a special teams group that scored an amazing 7 touchdowns! To this day, there is an erroneous belief among Longhorn faithful that the 2009 Texas offense was as effective as the 2008 unit. In fact, the two units weren’t in the same galaxy, but 2009 Texas TEAM SCORING (i.e. defense, special teams) obscured that fact.
TCU was the best team scoring team in the conference and that fact, paired with an underrated defense, is how they won 7 conference contests by 10 points or less and earned a playoff spot.
Note that the top 3 teams in scoring offense were the ones in the hunt late with two represented in the conference title game. Points on the board are a good thing. The hard luck Longhorns found yet another statistical category in which they excelled that didn’t translate cleanly to wins on the field.
Do the Oklahoma State numbers shock anyone? Bad OL play, a weak RB room and an erratic, oft injured Spencer Sanders contributed heavily to that feeble metric.
Iowa State couldn’t advance the ball and couldn’t get it in the end zone when they did. The Incel Offense. Let’s dig in a little deeper, control better for team scoring, and look at pure offensive efficacy…
Offense
| Index | Team | G | RUSH | PASS | PLAYS | YDS | AVG/P | TD | AVG/G |
|---|---|---|---|---|---|---|---|---|---|
| 1 | Oklahoma | 9 | 1899 | 2265 | 695 | 4164 | 6.0 | 34 | 462.7 |
| 2 | TCU | 10 | 1954 | 2665 | 710 | 4619 | 6.5 | 46 | 461.9 |
| 3 | Texas Tech | 9 | 1525 | 2563 | 769 | 4088 | 5.3 | 35 | 454.2 |
| 4 | Kansas State | 10 | 2007 | 2391 | 684 | 4398 | 6.4 | 42 | 439.8 |
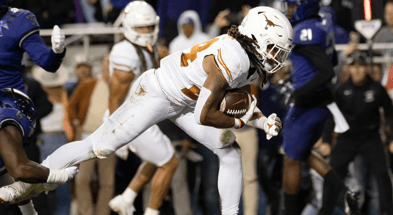
| 5 | Texas | 9 | 1884 | 2067 | 626 | 3951 | 6.3 | 39 | 439.0 |
| 6 | Baylor | 9 | 1625 | 2162 | 665 | 3787 | 5.7 | 33 | 420.8 |
| 7 | Kansas | 9 | 1546 | 2076 | 550 | 3622 | 6.6 | 36 | 402.4 |
| 8 | Oklahoma State | 9 | 1091 | 2361 | 721 | 3452 | 4.8 | 23 | 383.6 |
| 9 | West Virginia | 9 | 1334 | 2005 | 636 | 3339 | 5.3 | 29 | 371.0 |
| 10 | Iowa State | 9 | 828 | 2364 | 652 | 3192 | 4.9 | 17 | 354.7 |
Pure yardage can be empty calories if you don’t control for pace. The easiest way to control for pace is to look at yards per play. When you do that, the truly dangerous offenses come to the fore and paper tigers are lit ablaze.
Texas Tech team scoring (4th in the league), aggression on 4th down (which increases offensive output but also defensive points allowed) and their preferred pace gives the illusion of competent offense. Yards per play and functional eyeballs tell me differently. Oklahoma State used pace to partially obscure that their offense was about as effective as Iowa State’s on a per play basis. Yikes.
Kansas was the most explosive offense in the league, but they tended towards feast/famine and had more possession issues than Regan in the Exorcist. In some ways, Texas observed a similar pattern though the Texas offense actually played two or three distinct styles of offense over the course of the year. Flirting unsuccessfully with pass happy, exploring balanced, eventually settling on I’m just going to run your ass over with the best running back room in America.
Oklahoma had a good offense on balance, but it was pace dependent and they earned a debilitating goose egg against Texas with Dillon Gabriel out. That queered their season stats considerably. Texas, Kansas and Oklahoma had the worst times of possession in the Big 12. The knee jerk response to that is to blame the offense (citing complementary football, a phrase people use often, about 37% of the time correctly) but the fact is that a defense holds primary responsibility for opponents securing 15 play 80 yard drives and if you think your offense scoring a touchdown on a 4 play 80 yard drive is a bad thing, I can’t help you.
Kansas State liked a slow pace but finally found their big play upside in the passing game and high output with Will Howard at QB. He’s a better player than Adrian Martinez for how they’re built and he unlocked the most underrated big play wide receiver corps in the league with his willingness to grip it and rip it down the field.
Is running the ball important for offensive success? Extremely. But within a specific context.
Rushing Offense
| Index | Team | G | ATT | YDS | AVG | TD | YDS/G |
|---|---|---|---|---|---|---|---|
| 1 | Oklahoma | 9 | 394 | 1899 | 4.8 | 16 | 211.0 |
| 2 | Texas | 9 | 354 | 1884 | 5.3 | 21 | 209.3 |
| 3 | Kansas State | 10 | 400 | 2007 | 5.0 | 22 | 200.7 |
| 4 | TCU | 10 | 395 | 1954 | 4.9 | 23 | 195.4 |
| 5 | Baylor | 9 | 379 | 1625 | 4.3 | 20 | 180.6 |
| 6 | Kansas | 9 | 300 | 1546 | 5.2 | 17 | 171.8 |
| 7 | Texas Tech | 9 | 378 | 1525 | 4.0 | 19 | 169.4 |
| 8 | West Virginia | 9 | 321 | 1334 | 4.2 | 15 | 148.2 |
| 9 | Oklahoma State | 9 | 345 | 1091 | 3.2 | 13 | 121.2 |
| 10 | Iowa State | 9 | 284 | 828 | 2.9 | 6 | 92.0 |
The most effective offenses in the Big 12 ran the ball quite well. Not only by volume, but in per carry efficacy. Baylor, Texas Tech, West Virginia, Oklahoma State and Iowa State all struggled mightily and it’s not coincidental that they were the league’s worst offenses. Poor Iowa State and Oklahoma State couldn’t get over the yards per carry Mendoza line.
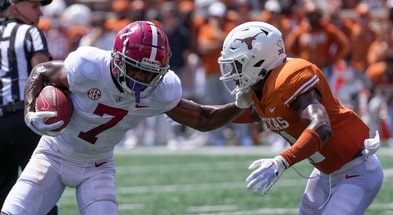
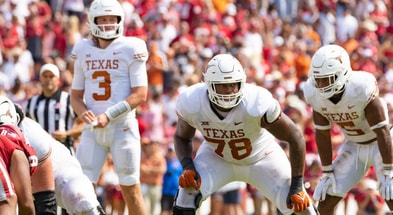
Texas boasting the league’s best per carry average is particularly impressive when you consider that Quinn Ewers provided no rushing value add, whereas the other good rushing offenses all had considerable rushing help from their QBs. Having the best backfield in college football and very underrated, often dominant, run blockers like Christian Jones helps.
Should 2022 running success correlation be as interpreted as install wishbone = profit? No. It actually suggests that the most effective running teams found ways to run from spread concepts because of their successful passing games. This is a study in AND not OR. It’s also a talent function: the league had good running backs, several capable running QBs who could also throw the ball and better than average run blocking on teams like TCU, OU, Texas and Kansas State.
On to passing….
Passing offense
| Index | Team | G | COMP | ATT | INT | PCT | YDS | AVG | TD | AVG/G |
|---|---|---|---|---|---|---|---|---|---|---|
| 1 | Texas Tech | 9 | 236 | 391 | 10 | 60.4 | 2563 | 6.6 | 16 | 284.8 |
| 2 | TCU | 10 | 198 | 315 | 4 | 62.9 | 2665 | 8.5 | 23 | 266.5 |
| 3 | Iowa State | 9 | 231 | 368 | 12 | 62.8 | 2364 | 6.4 | 11 | 262.7 |
| 4 | Oklahoma State | 9 | 204 | 376 | 14 | 54.3 | 2361 | 6.3 | 10 | 262.3 |
| 5 | Oklahoma | 9 | 181 | 301 | 8 | 60.1 | 2265 | 7.5 | 18 | 251.7 |
| 6 | Baylor | 9 | 179 | 286 | 10 | 62.6 | 2162 | 7.6 | 13 | 240.2 |
| 7 | Kansas State | 10 | 179 | 284 | 4 | 63.0 | 2391 | 8.4 | 20 | 239.1 |
| 8 | Kansas | 9 | 156 | 250 | 5 | 62.4 | 2076 | 8.3 | 19 | 230.7 |
| 9 | Texas | 9 | 159 | 272 | 6 | 58.5 | 2067 | 7.6 | 18 | 229.7 |
| 10 | West Virginia | 9 | 184 | 315 | 11 | 58.4 | 2005 | 6.4 | 14 | 222.8 |
Volume passing is deceptive isn’t it? Since the forward pass became a thing, passing efficiency is the goal – not the empty calories of passing attempts per se. To that end, Texas Tech is not the “best passing attack in the league” as I heard an idiot talking head opine a few Saturdays ago. They are, in fact, in the bottom half of the league and are quite limited in what they do.
TCU, Kansas and KSU were the real passing game stars and TCU gets the ultimate nod for marrying both volume to high efficiency with limited turnovers. That’s why Max Duggan is correctly the 2022 Big 12 MVP.
Texas was a middle of the road passing attack, a deceptive and inconsistent mean average between awesome (Oklahoma, West Virginia) and absolutely miserable (Oklahoma State, TCU).
While the rushing statistics are persuasive, they are best understood as a companion to a dangerous, viable passing game. In the absence of the latter, the former is difficult. That is the real key to modern football. Can I run it well enough to punish your light or honest box? Do I have enough offensive line and RB talent and grit to power it in the red zone for 6 instead of 3? Do I pass and run block well enough to avoid negative plays that prevent me from running the ball when I want to do it, avoiding perpetually chasing the sticks?
If a passing attack isn’t averaging over 7.5 yards per attempt, it’s hard to actually fulfill the potential of a running game. Understand this and you’re a graduate degree level football fan.
Finally Offensive FEI. I’m including this even though it’s not conference specific and it has its drawbacks, but it’s an interesting perspective nonetheless:
TCU 12
Kansas 14
Texas 16
Kansas State 17
Baylor 26
Oklahoma 28
West Virginia 35
Texas Tech 45
Oklahoma St 66
Iowa State 83
BONUS FUN CONTENT Texas A&M 77(!)
**
That’s how the conference broke down on offense. Several effective to good offenses, some middle of the road and a couple of real stinkers.