In my passion for college football and in my rage last year with 0-2 Notre Dame still being ranked in the AP Top-25 due to their high fake preseason ranking, I created a metric which I originally called the CFB "Quality Index" but have since renamed "On-Field Results Index" (OFRI) to be more reflective of what it actually shows.
Basically, it ignores any team-name bias, preseason bias, recruiting, last year's results, etc. etc. and ranks teams solely based on their this-year game results. The idea being, the only thing that truly matters is winning the football game. Not recruiting ranking, number of yards, offensive efficiency, etc., beating FCS teams by 40 vs by 80. It only matters Win or Lose. The metric is a computer formula that I keep in an advanced Excel workbook and update by adding in the game results each week.
I then take that idea, and I push it 2 layers deep. That is, it first cares about your record (i.e. 2-0 beats 1-1), but then cares about the records of the teams you beat (2-0 versus two teams that are 1-1 is better than being 2-0 versus two teams that are now 0-2). It takes that logic and goes one layer deeper, meaning not just the record of you, and who you played, but also who your opponents played.
In this way, I try to remove conference bias (i.e. oh the SEC is stronger than the Big Ten - well if it is, then in general their teams should have better records, and against good teams). I try to counteract every argument that usually happens around polls - i.e. a team is 10-0 but beat nobody, versus a team is 9-1, the 1 loss is against a good team say an 8-2 team, but this team also happens to have a win over a 9-1 team - versus the 10-0 team's best win is 7-3 or 6-4, something like that).
So, it's not a pure strength of schedule metric, it's not a strength of record, it's not the RPI/FPI - it only cares about this season's games (does not include FCS games as then it would need to include all FCS teams which is too much to deal with), and only grades winning or losing. Doesn't care by how much, only cares about the quality of the teams you beat and lost to, and the quality of the teams they beat and lost to. Very close to a true national "Standings" almost more than a "Ranking".
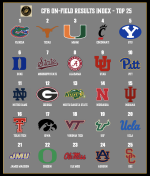
Because of this nature, it starts to look better after week 3 & 4 onwards as there is simply more data from this year, although still interesting after the first couple. So that said, now that I've done it for a year, and have it more robust, I will try to post each week the updated ranking. Here is Week 4:
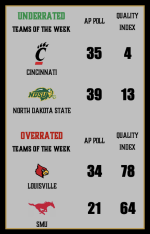
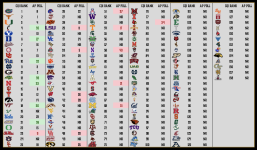
It's not meant to predict future game results, it's just meant to grade based on existing game results and who deserves to be ranked where. It also doesn't recalculate on itself - that is, a previous week's ranking has no meaning to the next week's ranking (unlike the AP Poll where a team could jump up for beating a preseason top-25 team who ends the season 6-6 and unranked and thus that preseason ranking ripple effect is carried through the whole season). It is fully recalculated each week based on the full season body of work.
That said, there have been some interesting cases of foresight - last year, this index had Indiana ranked as #1 after just Week 3 (the AP at the time had them #19). It wasn't until Week 8 that IU even got to #2 in the AP Poll, and eventually they became #1 and champs. This year, Florida jumped to #1 last week (Week 3), while they had just debuted in the AP Poll at #21. Of course, now they destroyed #4 Ole Miss this week, and UF is up to #8 in the AP. Could they be the unforeseen champs this year?
Other interesting notes for Week 4 - our friends UMass are #27. Again, this has nothing to do with biases, and includes no FCS games (so UMass is only 2-0 in the metric, not 4-0) with wins over Rutgers and Sac State. What I believe is propelling them up is Sac State having played NDSU, and RU having played USC, already. I expect UMass to actually continue to drop slightly as the Weeks go on even if they keep winning, just because other teams will start to play more other good teams.
Rutgers is not last despite 0-3 against FBS, being held up by UMass and USC - in fact, we are not even last in the P4 (GT, Kansas, Syracuse).
Let me know your thoughts and questions behind this and happy to answer and dig deeper into any of the rankings!
Basically, it ignores any team-name bias, preseason bias, recruiting, last year's results, etc. etc. and ranks teams solely based on their this-year game results. The idea being, the only thing that truly matters is winning the football game. Not recruiting ranking, number of yards, offensive efficiency, etc., beating FCS teams by 40 vs by 80. It only matters Win or Lose. The metric is a computer formula that I keep in an advanced Excel workbook and update by adding in the game results each week.
I then take that idea, and I push it 2 layers deep. That is, it first cares about your record (i.e. 2-0 beats 1-1), but then cares about the records of the teams you beat (2-0 versus two teams that are 1-1 is better than being 2-0 versus two teams that are now 0-2). It takes that logic and goes one layer deeper, meaning not just the record of you, and who you played, but also who your opponents played.
In this way, I try to remove conference bias (i.e. oh the SEC is stronger than the Big Ten - well if it is, then in general their teams should have better records, and against good teams). I try to counteract every argument that usually happens around polls - i.e. a team is 10-0 but beat nobody, versus a team is 9-1, the 1 loss is against a good team say an 8-2 team, but this team also happens to have a win over a 9-1 team - versus the 10-0 team's best win is 7-3 or 6-4, something like that).
So, it's not a pure strength of schedule metric, it's not a strength of record, it's not the RPI/FPI - it only cares about this season's games (does not include FCS games as then it would need to include all FCS teams which is too much to deal with), and only grades winning or losing. Doesn't care by how much, only cares about the quality of the teams you beat and lost to, and the quality of the teams they beat and lost to. Very close to a true national "Standings" almost more than a "Ranking".
Because of this nature, it starts to look better after week 3 & 4 onwards as there is simply more data from this year, although still interesting after the first couple. So that said, now that I've done it for a year, and have it more robust, I will try to post each week the updated ranking. Here is Week 4:
It's not meant to predict future game results, it's just meant to grade based on existing game results and who deserves to be ranked where. It also doesn't recalculate on itself - that is, a previous week's ranking has no meaning to the next week's ranking (unlike the AP Poll where a team could jump up for beating a preseason top-25 team who ends the season 6-6 and unranked and thus that preseason ranking ripple effect is carried through the whole season). It is fully recalculated each week based on the full season body of work.
That said, there have been some interesting cases of foresight - last year, this index had Indiana ranked as #1 after just Week 3 (the AP at the time had them #19). It wasn't until Week 8 that IU even got to #2 in the AP Poll, and eventually they became #1 and champs. This year, Florida jumped to #1 last week (Week 3), while they had just debuted in the AP Poll at #21. Of course, now they destroyed #4 Ole Miss this week, and UF is up to #8 in the AP. Could they be the unforeseen champs this year?
Other interesting notes for Week 4 - our friends UMass are #27. Again, this has nothing to do with biases, and includes no FCS games (so UMass is only 2-0 in the metric, not 4-0) with wins over Rutgers and Sac State. What I believe is propelling them up is Sac State having played NDSU, and RU having played USC, already. I expect UMass to actually continue to drop slightly as the Weeks go on even if they keep winning, just because other teams will start to play more other good teams.
Rutgers is not last despite 0-3 against FBS, being held up by UMass and USC - in fact, we are not even last in the P4 (GT, Kansas, Syracuse).
Let me know your thoughts and questions behind this and happy to answer and dig deeper into any of the rankings!