I was asked on 34 and Counting about how accurate the pre-season rankings are. Given that lineups are not yet known for every team until somewhere in the middle third of the season, injuries happen, and freshmen are generally not ranked in the pre-season (and then take some time to find their true ranking during the season), I do not know how worthwhile the exercise would be. And it would be a large amount of work, so I am not doing that.
Instead I will give myself a score.
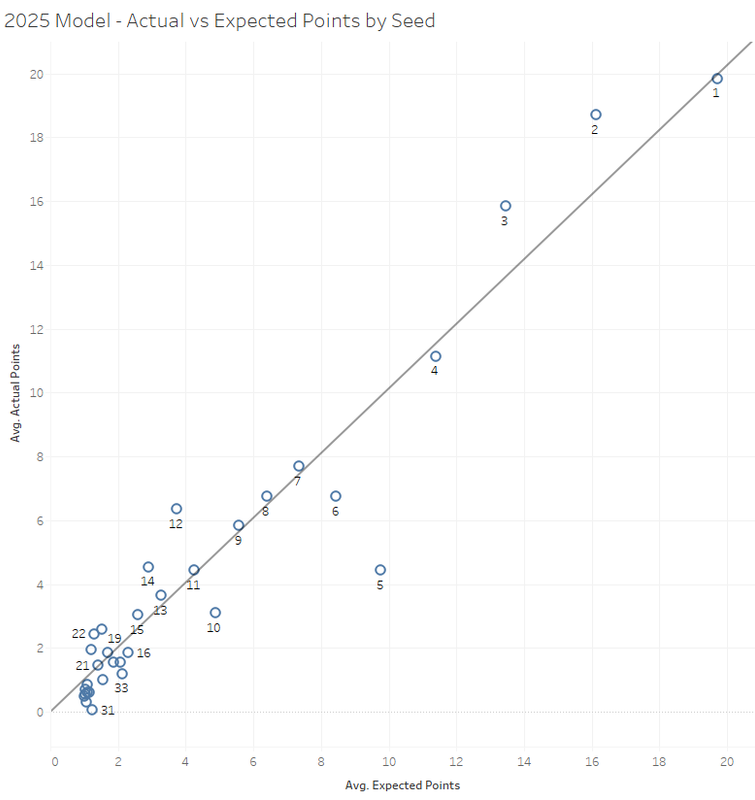
In 2025 my expected points model had an r-squared of 0.956. Not bad. Because my numbers are based on past results they generally handle over and under performance well at summary levels (team scores, seed performance across all ten weights), but there is always a lot of volatility at the individual wrestler level.
The big outlier was the #5 seed which performed historically bad with only 3 AA's from the group of ten. You have to go back to 1980 to find the #5 seed perform at that level.
Instead I will give myself a score.
In 2025 my expected points model had an r-squared of 0.956. Not bad. Because my numbers are based on past results they generally handle over and under performance well at summary levels (team scores, seed performance across all ten weights), but there is always a lot of volatility at the individual wrestler level.
The big outlier was the #5 seed which performed historically bad with only 3 AA's from the group of ten. You have to go back to 1980 to find the #5 seed perform at that level.


