Tale of the Tape: WVU vs TCU
It’s time for our weekly Tale of the Tape feature, where we compare West Virginia against its upcoming opponent using the NCAA’s official stats. This week, the Mountaineers return home to face TCU, and the Horned Frogs’ numbers point to one of the Big 12’s more explosive offensive units.
TCU has been dynamic through the air, ranking among the nation’s top passing teams and one of the most efficient on third down. The Horned Frogs average 437.3 yards per game, including over 300 passing yards, and are scoring more than 36 points per contest. Defensively, they’ve been inconsistent but opportunistic, forcing turnovers and winning possession battles with a balanced approach.
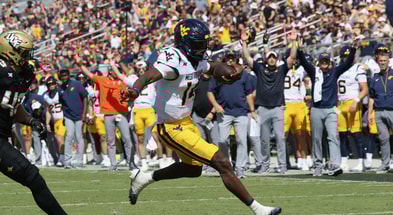
West Virginia, meanwhile, continues to rely on its ground game while looking for improvement in the passing attack. The Mountaineers remain strong in the red zone and have done well limiting penalties, but they’ll need to establish rhythm on offense and tighten things up on defense to compete with a high-powered TCU group.
West Virginia vs TCU statistical comparison
| Stat | WVU Rank | WVU Value | TCU Rank | TCU Value | Edge |
|---|---|---|---|---|---|
| Total Offense | 99 | 354.1 | 32 | 437.3 | TCU |
| Rushing Offense | 32 | 195.4 | 102 | 128.0 | WVU |
| Passing Offense | 124 | 158.7 | 7 | 309.3 | TCU |
| Team Passing Efficiency | 127 | 111.86 | 21 | 159.35 | TCU |
| Scoring Offense | T-110 | 21.0 | T-24 | 36.3 | TCU |
| Total Defense (lower better) | 113 | 416.4 | 86 | 382.3 | TCU |
| Rushing Defense (lower better) | 102 | 169.3 | 50 | 130.6 | TCU |
| Passing Yards Allowed (lower better) | 107 | 247.1 | 110 | 251.7 | WVU |
| Team Passing Efficiency Defense (lower better) | 105 | 143.97 | 90 | 138.09 | TCU |
| Scoring Defense (lower better) | 110 | 30.9 | 84 | 26.3 | TCU |
| Turnover Margin (higher better) | T-67 | 0.00 | T-31 | 0.57 | TCU |
| 3rd Down Conversion Pct (higher better) | T-131 | 0.294 | 11 | 0.527 | TCU |
| 4th Down Conversion Pct (higher better) | T-106 | 0.429 | T-50 | 0.615 | TCU |
| 3rd Down Conversion Pct Defense (lower better) | 30 | 0.337 | 101 | 0.427 | WVU |
| 4th Down Conversion Pct Defense (lower better) | 112 | 0.667 | 122 | 0.692 | WVU |
| Red Zone Offense | 19 | 0.944 | T-87 | 0.813 | WVU |
| Red Zone Defense (lower better) | 37 | 0.793 | 97 | 0.880 | WVU |
| Net Punting | 60 | 40.05 | 52 | 40.40 | TCU |
| Punt Returns | 81 | 8.11 | 130 | 1.83 | WVU |
| Kickoff Returns | 54 | 21.50 | 34 | 23.60 | TCU |
| First Downs Offense | 89 | 136 | 48 | 155 | TCU |
| First Downs Defense (lower better) | 80 | 143 | 99 | 148 | WVU |
| Fewest Penalties Per Game (lower better) | 50 | 6.00 | 83 | 6.71 | WVU |
| Fewest Penalty Yards Per Game (lower better) | 62 | 53.57 | 111 | 65.71 | WVU |
| Time of Possession (higher better) | 130 | 26:21 | 123 | 27:18 | TCU |
Final Edge Totals: WVU 8 — TCU 17 — Even 1
On paper, the advantage leans heavily toward TCU. The Horned Frogs feature one of the nation’s top passing attacks and have been highly efficient in converting scoring opportunities. For West Virginia to reverse course, the Mountaineers must establish the run early, sustain drives on third down, and find ways to limit explosive plays through the air.
Offer Alert
Fall camp is here and there’s no better time to sign up with us to get all your WVU intel! Sign up today – $1 for the first week, plus a complimentary year of access to The Athletic included. Join – http://gowvu.us/Join


__________________________________________
• Talk about it with West Virginia fans on The Blue Lot
• SUBSCRIBE today to stay up on the latest on Mountaineer sports and recruiting
• Get all of our WVU videos on YouTube by subscribing to the WVSports.com Channel
• Follow us on Twitter: @WVSportsDotCom, @rivalskeenan
•Like us on Facebook, Instagram and TikTok