Normally on gamedays I provide a "tale of the tape" to compare the stats between the two teams, but today I wanted to see how the evenly matched opponents compare other teams in the SEC and around the nation. Their rankings are in parenthesis, with the national rankings following the SEC rankings.
Team Stats

Individual Leaders
Rushing
- Ralph Webb
- Yards per game: 116,4 (1, 14)
- Yards per carry: 4.93 (27)
- Touchdowns: 5 (t-3, t-35)
- Boom Williams
- Yards per game: 97.2 (5, 36)
- Yards per carry: 7.25 (5, 35)
- Touchdowns: 2 (t-20)
- Benny Snell
- Yards per game: 49.2 (21)
- Yards per carry: 6.02 (15, 87)
- Touchdowns: 5 (t-3, t-35)
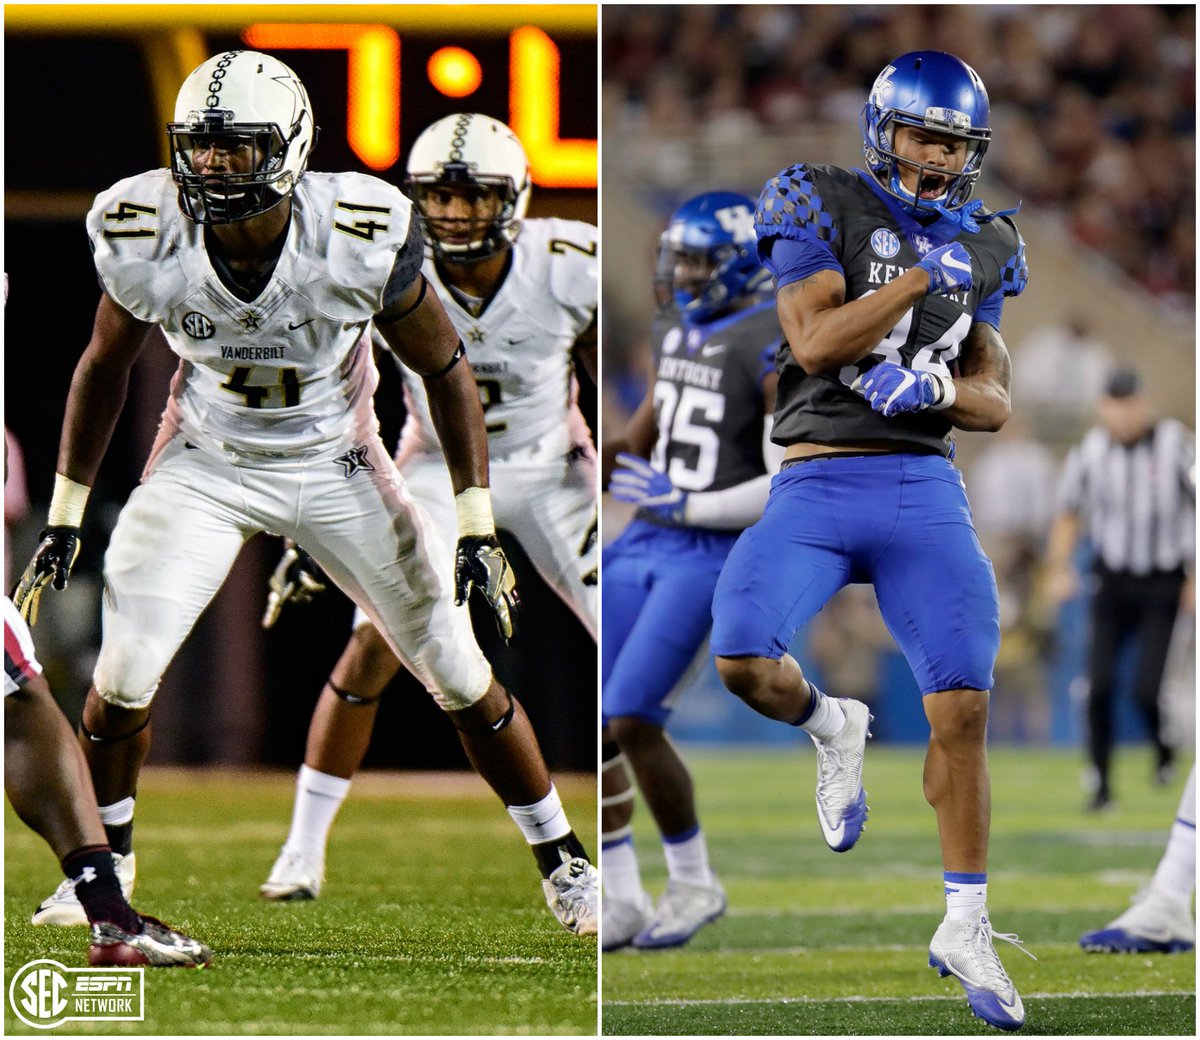
Tackles
- Zach Cunningham: 52 (1, t-10)
- Jordan Jones: 51 (2, t-14)
- Mike Edwards: 43 (4, t-42)
What Does It Mean?
The untrained eye would believe the Vanderbilt defense is dominant, but that's not the case. Vanderbilt's defense isn't as good as you'd think, just like Kentucky's defense isn't as bad as you think. Kentucky's rush offense and Vanderbilt's rush defense are the only two with any statistical separation. It's up to the highlighted individuals to be the game's difference-makers.


Discuss This Article
Comments have moved.
Join the conversation and talk about this article and all things Kentucky Sports in the new KSR Message Board.
KSBoard