US Job Creation Index Continues to Hit New Highs

by RJ Reinhart
STORY HIGHLIGHTS
- Gallup Job Creation Index stands at +37 for March
- This is the third consecutive month the index has reached a record high
- Job creation strongest in Midwest (+39) and South (+38)
WASHINGTON, D.C. -- The Gallup Job Creation Index rose to +37 in March from +35 in February. This is the third month in a row the index has hit a new record high after remaining relatively flat for much of 2016.
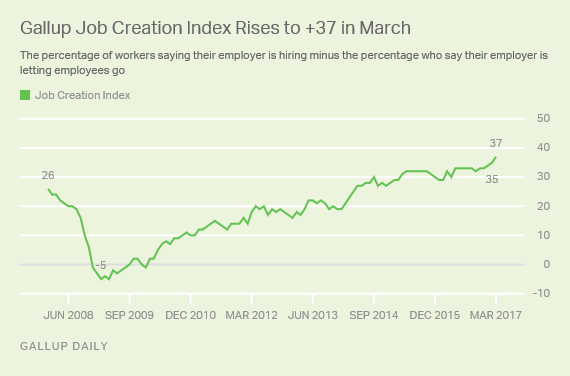
Since the start of the year, the index has already increased by four points -- the same increase seen throughout all of 2016. However, the index typically rises during the first quarter of the year, with two- to three-point increases seen during this period in most years since 2010.
These latest data are based on March 1-31 interviewing as part of Gallup Daily tracking.
The Gallup Job Creation Index is based on employed U.S. adults' perceptions of whether their employer is hiring or letting people go. The index is computed by subtracting the percentage of those who say their employer is cutting jobs from the percentage of those who say their employer is adding jobs. In March, 46% of employees said their company was hiring, up from 44% in February. Meanwhile, the percentage who said their company was letting workers go held steady at 9%.
While the index does account for the quality or types of jobs added or lost, or whether they are full or part time, it does provide one perspective on general hiring conditions in the U.S.
Job Creation Strongest in the Midwest and South
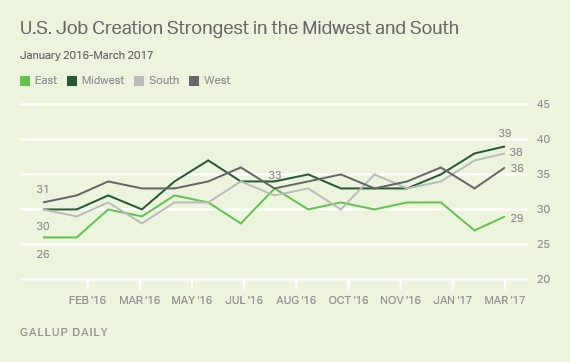
In March, the Job Creation Index was +39 in the Midwest, with the South following close behind at +38 -- setting record highs for both regions and making the Midwest the strongest region for job creation in the U.S. for the second consecutive month. The West, at +36, has lagged behind the Midwest and South for the past two months.
Job creation was weakest in the East in March, with the region scoring +29. The East has fallen behind the three other regions since November. Additionally, the East has trailed behind the rest of the country in 11 out of 15 months since January 2016. During that period, the East averaged an index score of +30, two points behind the South and four points behind the West and Midwest.
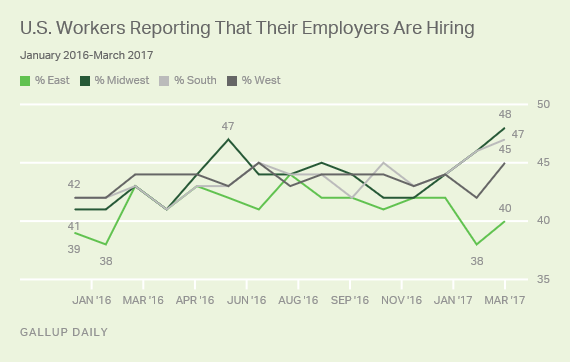
Workers' reports of hiring at their workplaces in the East have either been the lowest or tied for the lowest of all four regions since September. Only once between January 2016 and March 2017 did reports of hiring in the East rise to the top of the four regions -- 44% in August 2016 -- though the region tied that month with the Midwest and the South.
Bottom Line
The continued record highs in the Gallup Job Creation Index coincide with several positive economic signals. The Bureau of Labor Statistics' job creation estimates for January and February both exceeded expectations. Additionally, while currently down from record highs, the stock market has performed well over the past several months, and the Nasdaq composite ended the first quarter of 2017 with its best performance since 2013.
While the country as a whole has experienced record-high job creation, it has not occurred evenly across the country. The East has lagged behind other regions for at least seven months, with employers there reportedly hiring fewer new employees than in other areas.
These data are available in Gallup Analytics.
Gallup.com reports results from these indexes in daily, weekly and monthly averages and in Gallup.com stories. Complete trend data are always available to view in the following charts:
Daily: Employment, Economic Confidence, Consumer Spending
Weekly: Employment, Economic Confidence, Job Creation, Consumer Spending
Read more about Gallup's economic measures.
View our economic release schedule.