http://www.dailymail.co.uk/news/art...atures-suggesting-rise-not-man-emissions.html
Looks like El Nino has ended and the temperatures have dropped dramatically as they did 17 years ago.
Also, Arctic ice is back to where it was 13 years ago.
Inevitably, when even satellite temperatures were showing 2016 as “the hottest year on record”, we were going to be told last winter that the Arctic ice was at its lowest extent ever. Sure enough, before Christmas, a report from the US National Oceanic and Atmospheric Administration was greeted with such headlines as “Hottest Arctic on record triggers massive ice melt”. In March we had the BBC trumpeting another study that blamed vanishing Arctic ice as the cause of weather which led to the worst-ever smog in Beijing, warning that it “could even threaten the Beijing Winter Olympics in 2022”.
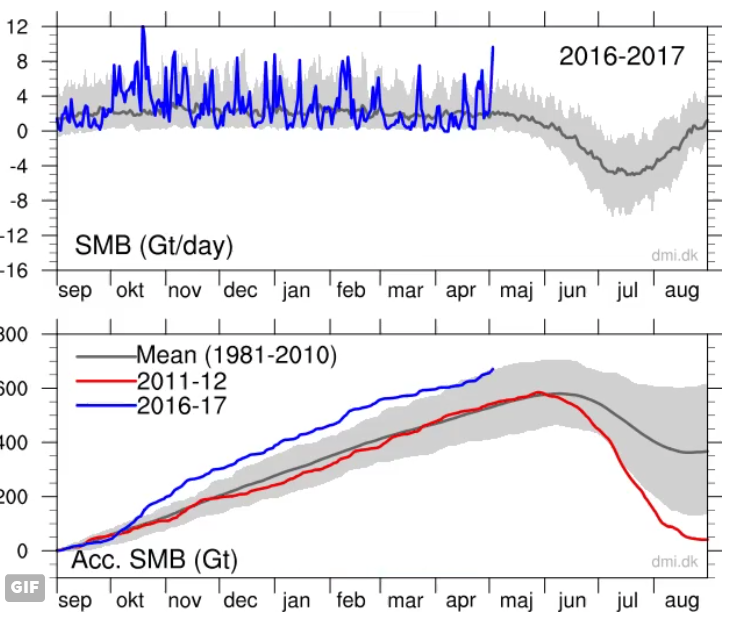
But last week we were brought back to earth by the Danish Meteorological Institute (DMI), as charted by our friend Paul Homewood on his blog Notalotofpeopleknowthat, with the news that ever since December temperatures in the Arctic have consistently been lower than minus 20 C. In April the extent of Arctic sea ice was back to where it was in April 13 years ago. Furthermore, whereas in 2008 most of the ice was extremely thin, this year most has been at least two metres thick. The Greenland ice cap last winter increased in volume faster than at any time for years.
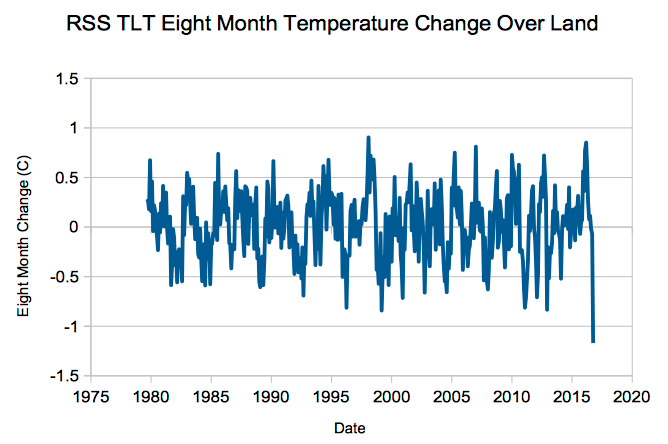
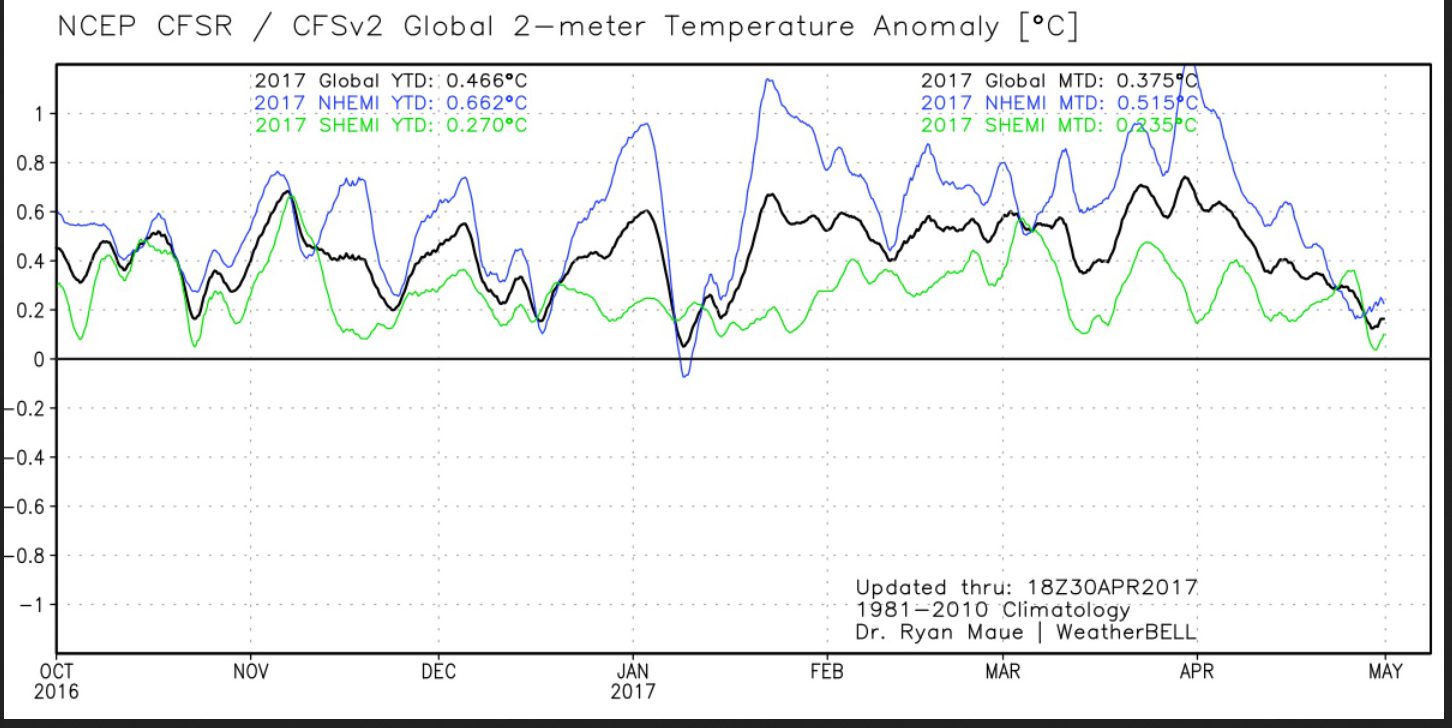
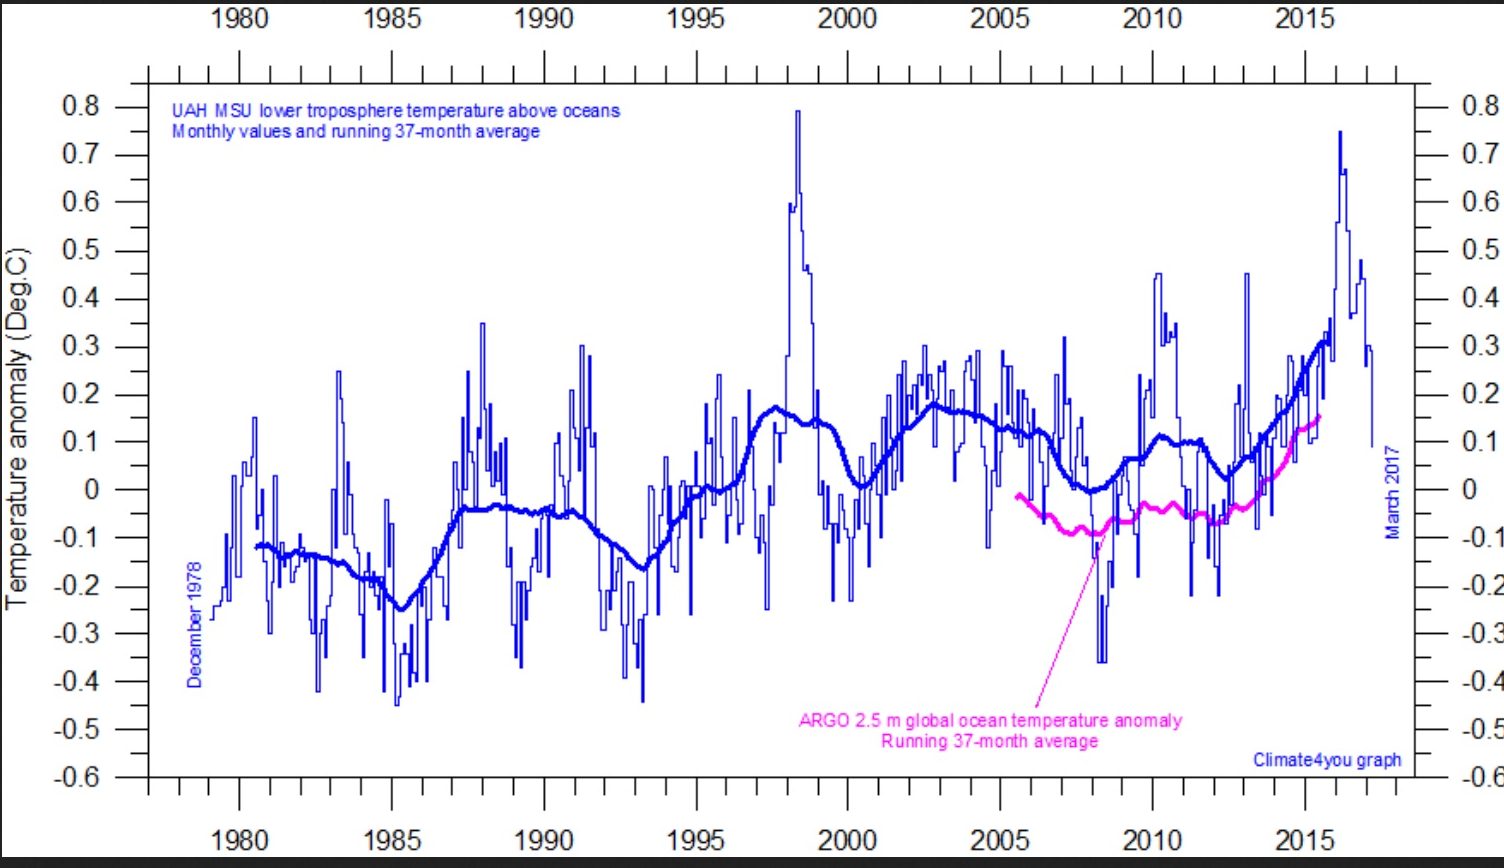
As for those record temperatures brought in 2016 by an exceptionally strong El Niño, the satellites now show that in recent months global temperatures have plummeted by more that 0.6 degrees: just as happened 17 years ago after a similarly strong El Niño had also made 1998 the “hottest year on record”.
This means the global temperature trend has now shown no further warming for 19 years. But the BBC won’t be telling us any of this. And we are still stuck with that insanely damaging Climate Change Act, which in this election will scarcely get a mention.
Full post
Looks like El Nino has ended and the temperatures have dropped dramatically as they did 17 years ago.
Also, Arctic ice is back to where it was 13 years ago.
- Date: 07/05/17
- Christopher Booker, The Sunday Telegraph
Inevitably, when even satellite temperatures were showing 2016 as “the hottest year on record”, we were going to be told last winter that the Arctic ice was at its lowest extent ever. Sure enough, before Christmas, a report from the US National Oceanic and Atmospheric Administration was greeted with such headlines as “Hottest Arctic on record triggers massive ice melt”. In March we had the BBC trumpeting another study that blamed vanishing Arctic ice as the cause of weather which led to the worst-ever smog in Beijing, warning that it “could even threaten the Beijing Winter Olympics in 2022”.
But last week we were brought back to earth by the Danish Meteorological Institute (DMI), as charted by our friend Paul Homewood on his blog Notalotofpeopleknowthat, with the news that ever since December temperatures in the Arctic have consistently been lower than minus 20 C. In April the extent of Arctic sea ice was back to where it was in April 13 years ago. Furthermore, whereas in 2008 most of the ice was extremely thin, this year most has been at least two metres thick. The Greenland ice cap last winter increased in volume faster than at any time for years.
As for those record temperatures brought in 2016 by an exceptionally strong El Niño, the satellites now show that in recent months global temperatures have plummeted by more that 0.6 degrees: just as happened 17 years ago after a similarly strong El Niño had also made 1998 the “hottest year on record”.
This means the global temperature trend has now shown no further warming for 19 years. But the BBC won’t be telling us any of this. And we are still stuck with that insanely damaging Climate Change Act, which in this election will scarcely get a mention.
Full post