Breaking down Kentucky basketball's 2022-2023 shot chart
Everyone go find a stick and the closest dead horse. We have some beating to do when it comes to critiquing Kentucky’s shot selection from the 2022-23 season.
If you are the type to move on quickly from a painful chapter and are already fully invested in the hype of next year’s team, especially following the show the new recruits put on at the McDonald’s All-American Game, then, by all means, exit now and keep your optimism high. However, if you’re like me and still feel the need to wallow in the coulda-woulda-shoulda past for an unnecessarily long time, then follow me down this dimly-lit path of Kentucky basketball shot chart analytics.
First, a major caveat: Kentucky finished 17th in Kenpom’s Adjusted Offensive Efficiency category, so if you’re in the camp of “Long 2s can still win ballgames,” then grab onto that ranking and hold on it with the strength of Oscar Tshiebwe grabbing a rebound. Kentucky ranked second in this category in the SEC behind Missouri and ahead of league champ, Alabama, which embraces the modern basketball mindset of maximizing field goal attempts at the rim and from behind the arc as much as anyone in college basketball.
Of course, it is certainly possible to win the way Kentucky plays. John Calipari has done it so much in the past, the basketball overlords put him in the Hall of Fame. The fact is, however, the game has changed, and coaches now lean heavily into freshly-available statistical probability rather than embracing the playbooks of old.
Why not follow the numbers and give yourself the best statistical advantage you can? This won’t come as a shock, but Kentucky did not exactly do that this year.
Thanks to CBBAnalytics.com for their advanced charts; let’s dive in.
Kentucky’s shot chart
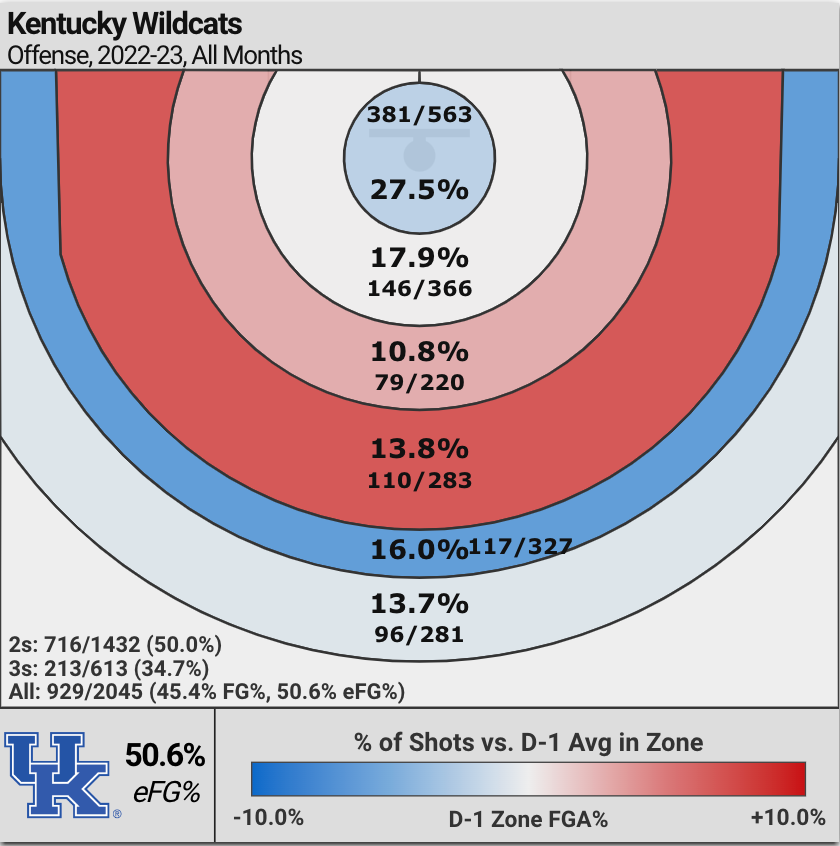
This chart depicts Kentucky’s shot selection this season. Starting with the inner circle and working outwards, the zones correlate to shots at the rim, 4 to 10 feet, 10 to 15 feet, 2s greater than 15 feet, 3s shorter than 25 feet, and 3s between 25 and 30 feet. The percentages indicate the number of shots taken from each zone compared to all of Kentucky’s field goal attempts.
The darker the red, the further above the D1 average. The darker the blue, the further below the D1 average.
For what it’s worth, Kentucky shot four 3s further than 30 feet that are not represented here, which is why the percentage totals add up to 99.7%. They missed them all.
If modern basketball maximizes layups and 3s, a quick glance at this chart tells you Kentucky does the complete opposite of that. The only shot distances where Kentucky shows up blue (below D1 average in the percentage of their shots taken from these areas) are at the rim and behind the arc.
Worse yet, they are borderline Cardinal-red in the 2-pointers-longer-than-15-foot zone, and everyone would agree that is an ugly shade of red.
The average D1 team only shot 7.1% of their shots from this range meaning Kentucky was nearly double that at 13.8%. Similarly, Kentucky is 3% higher than the D1 average on shots between 10 and 15 feet.
And if I could pick another big blue nit from this chart, notice now Kentucky shot nearly half of their 3s from further than 25 feet. The college 3-point line is at 22 feet 1 3⁄4 inch. Antonio Reeves can make it rain from anywhere but why not shoot a step closer to the line? Those go in more often.
Top 5 most efficient offenses’ shot charts
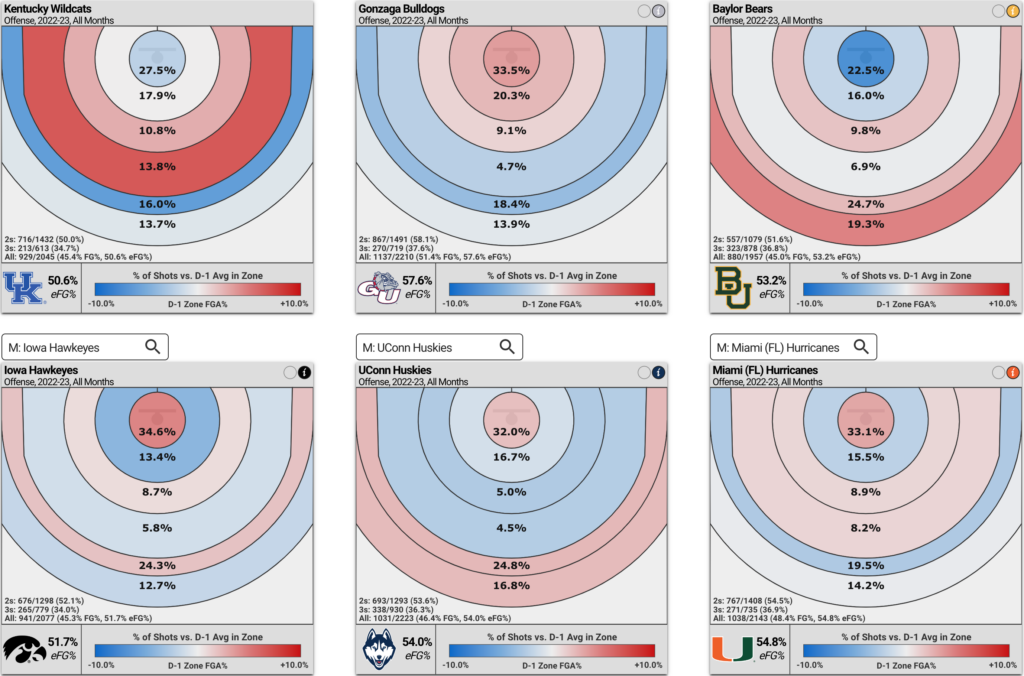
According to KenPom, the five most efficient offenses in college basketball are Gonzaga, Baylor, Iowa, UConn, and Miami. Two of those teams are in the Final Four.
When you compare their shot charts to Kentucky’s, it doesn’t take long to see the difference. 24.6% of Kentucky’s total shots were 2-pointers further 10 feet away. Amongst the most efficient teams in college basketball, the only team remotely close to that number is Miami at 17.1%.
UConn, the odds-on favorite to win the title, shoots just 9.5% of their shots in this zone while the other three teams range between 13% and 16%.
Remarkably, 53.8% of Gonzaga’s shots came within 10 feet; call it the Drew Timme effect. On the other hand, Baylor is the only team in the top 5 to shoot fewer of their shots within 10 feet than Kentucky, as they do most of their damage from long range.
It is no surprise UConn’s major focus on offense is to get close looks and put up 3s. 48.7% of UConn’s shots come down low while 41.8% of their attempts are from deep. That means over 90% of their shots are either 3s or from within 10 feet.
It is the type of shot chart analytics nerds drool over.
Kentucky’s effective field goal percentage chart
Okay, Kentucky shot a lot of long 2s this year, but did they make them? Sort of. Not really.
When it came to the longest of 2s, those greater than 15 feet, Kentucky shot 38.9%. This was actually slightly above the D1 average of 36.6% when it comes to raw shooting percentage. For shots between 10 and 15 feet, they shot 35.9%, slightly lower than the D1 average of 36.3%.
The real story, though, comes when you look at the team’s effective field goal percentage (eFG%), which takes into account that 3s are worth 50% more than 2s.
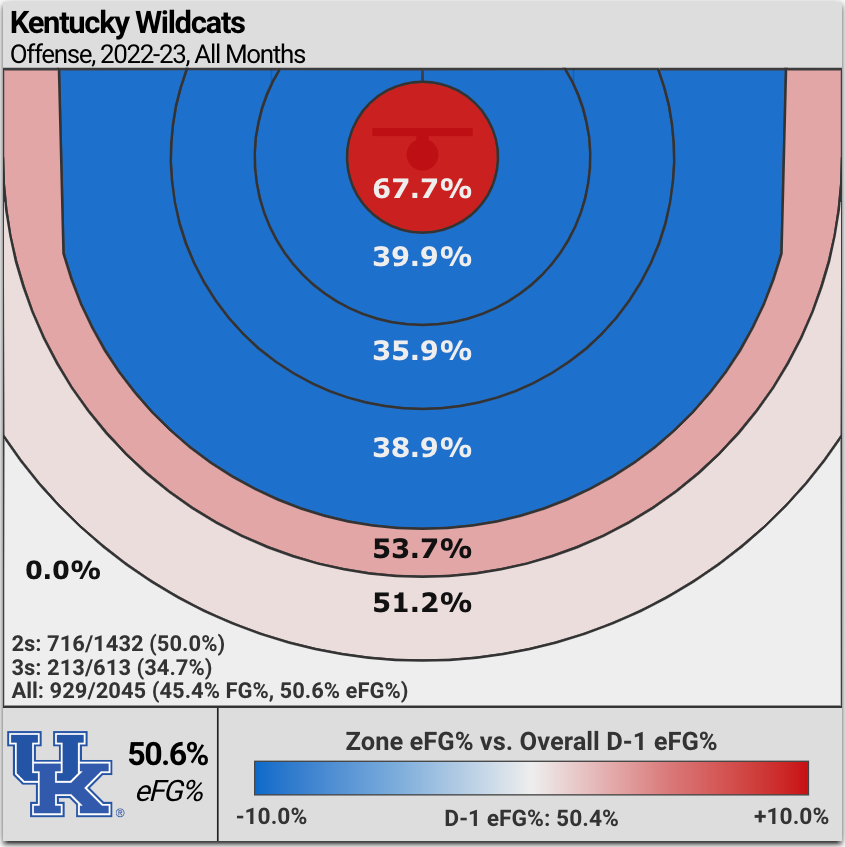
This chart is a rare case when blue is bad and red is good.
When it comes to eFG%, Kentucky shot more than 10 percentage points worse than the D1 average from 2-point range everywhere besides at the rim.
Respect, Oscar.
To say the implied part verbatim, Kentucky shot better than most teams in the two areas on the floor where they shot far fewer attempts.
Ugh.
Points per attempt
I’ll be the first to admit I did not exactly breeze through my statistics class at the University of Kentucky. Terms like eFG% can sound a little abstract for the vast majority of humans who primarily use calculators for figuring out the proper tip amount to leave their waiter.
To simplify it all, the numbers really stand out when you convert these effective field goal percentages to points per shot attempt. This is how many points on the scoreboard go up every time Kentucky takes a shot from this range:
- Within 10 feet: 1.13 points per attempt
- 2-pointers further than 10 feet: 0.75 points per attempt
- 3-pointers (any distance): 1.04 points per attempt
On any given play, the midrange jumper may be the best option. It may be all the defense gives you. That happens and you have to take the best shot available to you on any given possession. Similarly, in any given game, sometimes 3-pointers just don’t fall. It is frustrating but look no further than Kentucky’s last game as proof that it happens.
However, in the long run, when you extrapolate everything over the course of a season, teams put more points on the scoreboard by taking 3s and high-percentage looks close to the rim. That’s just the math.
Player shot charts
Who was responsible for so many of these long 2s? Pretty much everyone, to be honest. Some players were more apt to shoot the deep 2 than others, but no one’s shot chart looks ideal in the world of modern basketball analytics.
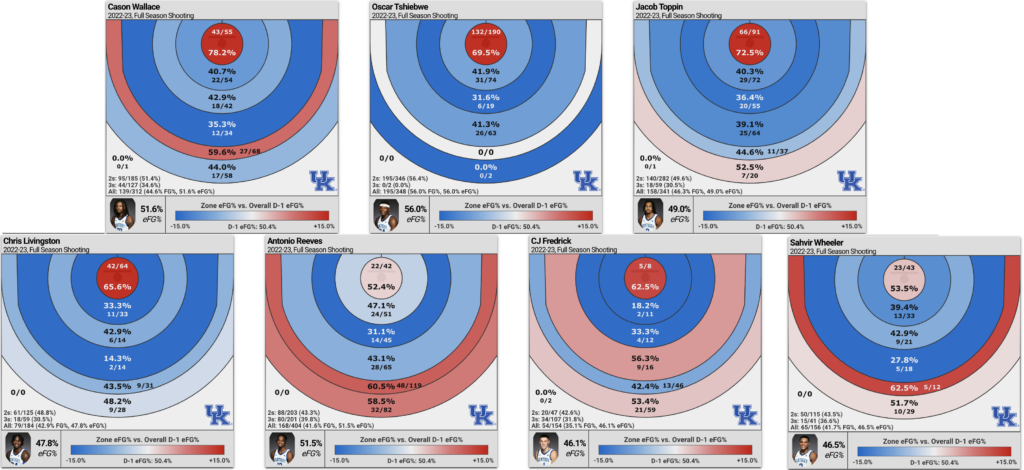
These charts stay in the very telling eFG% category and show far and away the most efficient shot for Kentucky this season was Wallace, Tshiebwe, Toppin, or Livingston at the rim, or Reeves from 3. When Wallace wasn’t shooting them from too deep, his 3-pointer was also a proficient way for the ‘Cats to score.
Sahvir Wheeler’s 3s look good as well, though his sample size is relatively smaller for obvious reasons.
Surprisingly, CJ Fredrick’s shot chart breaks conventional wisdom, as he shot poorly from 3 (especially considering his reputation coming from Iowa), but he was also the only rotation player to shoot a better eFG% than the D1 average from the dreaded long-2 zone, albeit on only 16 shots.
Should Kentucky evolve its playing style?
Kevin Durant once debated an analytics guy on Twitter who was trashing the midrange jumper, claiming he has had a ton of success mastering the art of the midrange. He’s right. Over the last 25 NBA seasons, only thrice out of over 1700 times has a player who shot at least 250 midrange shots made 55% or more of them. And it was Kevin Durant all three times.
Among other data points, the analytics guy responded, “You get to shoot wherever you want! You’re Kevin Durant!”
So barring one of the greatest players ever to play the game suiting up for Kentucky basketball (who knows, KD changes teams regularly), these rules generally apply to most college players.
That being said, all of this is much easier to blog about than execute on the court. Oscar Tshiebwe understandably lived in the paint this season, causing other players to often find a clogged lane when driving to the basket. Moreover, Antonio Reeves proved to be the team’s only reliable shooter from distance. So, perhaps this particular Kentucky squad wasn’t built for a modern basketball philosophy full of layups and 3s.
But it would be nice to at least see them try.
Kentucky can still win by playing the style of basketball that made John Calipari famous. Next season may be a great example of that. But numbers don’t lie. Numbers don’t play favorites. And numbers won’t ever say, “I haven’t seen him.”
As much success as Kentucky basketball has had historically, a shift toward the gravity of analytics may be the best way to keep the ‘Cats from continuing to fall short.


Discuss This Article
Comments have moved.
Join the conversation and talk about this article and all things Kentucky Sports in the new KSR Message Board.
KSBoard