Obamanomics in one easy chart
- Thread starter WVPATX
- Start date
You are using an out of date browser. It may not display this or other websites correctly.
You should upgrade or use an alternative browser.
You should upgrade or use an alternative browser.

Better than I expected. In no way would I have considered Obama to be half the man The Gipper was. It looks like on this metric he is just shy of it.
Don't forget, the IRAD money that was able to be sunk into the tech world during the 80s was responsible for the tech boom of the 90s.It is amazing what lower taxes, lower regulating and a stronger military can do for you.
How do the respective recessions they were recovering from compare?
WVPATX likes to keep things really simple. Also were there subsequent or concurrent recessions taking place in other regions around the world for the early 80's recession like there were this time? For this recession, America was hit first and as we tried to recover, Europe and other regions were just heading into recession. It's hard to recover when the rest of the globe is struggling. The early 80's recession was bad but I don't think it compares to the recent recession highlighted by the real estate/mortgage/banking collapse that GeeDub oversaw. Throwing one chart up like WVPATX did is fairly meaningless without a broader comparison of other regional economies at those times. A typical troll post at this point.How do the respective recessions they were recovering from compare?
WVPATX likes to keep things really simple. Also were there subsequent or concurrent recessions taking place in other regions around the world for the early 80's recession like there were this time? For this recession, America was hit first and as we tried to recover, Europe and other regions were just heading into recession. It's hard to recover when the rest of the globe is struggling. The early 80's recession was bad but I don't think it compares to the recent recession highlighted by the real estate/mortgage/banking collapse that GeeDub oversaw. Throwing one chart up like WVPATX did is fairly meaningless without a broader comparison of other regional economies at those times. A typical troll post at this point.
Since GDP comparisons were used, this should provide some perspecitve:
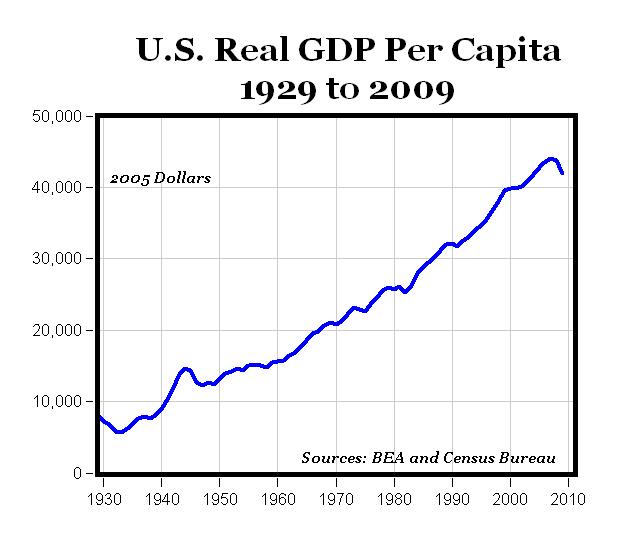
From a GDP perspective, this represents historical data, so you can see what GDP looks like going into the respective terms. The downturn going into 2009 is rivaled only by the Great Depression and WWII. It wouldn't appear as if Reagan faced anything close to the downturn that was happening in 2008-2009.
I mean, if we are being impartial and honest about data ... Ford(R) 74-77, Carter (D) 77-81, Reagan (R) 81-89, Bush(R) 89-93, Clinton (D) 93-2001, Bush (R) 2001-2009, Obama (D) 2009-present. I'll see if I can find something that extends to today.
Odd that both of you provided seemingly contradictory statistics from the same source.Since GDP comparisons were used, this should provide some perspecitve:
From a GDP perspective, this represents historical data, so you can see what GDP looks like going into the respective terms. The downturn going into 2009 is rivaled only by the Great Depression and WWII. It wouldn't appear as if Reagan faced anything close to the downturn that was happening in 2008-2009.
I mean, if we are being impartial and honest about data ... Ford(R) 74-77, Carter (D) 77-81, Reagan (R) 81-89, Bush(R) 89-93, Clinton (D) 93-2001, Bush (R) 2001-2009, Obama (D) 2009-present. I'll see if I can find something that extends to today.
Odd that both of you provided seemingly contradictory statistics from the same source.
Well, they aren't really that contradictory because mine only included the data leading into Obama's presidency, where his includes Obama's presidency.
I provided mine as a comparison point regarding the kind of recovery task facing each. They weren't facing the same level of collapse/recession domestically or globally.
Also. His graph is of real GDP growth, whereas mine is Real GDP per Capita, which in my opinion is more meaningful than simply the GDP. Also, compares Reagan, Obama and everybody else post 1960, but again, nobody else faced the same downturn in that timeframe. You have to go back to the Great Depression and WWII to find that.
I will try to find the graph for "my" data that extends to the current date.
I can't get it to save the chart or embed it here, but you can go to the following page:
http://www.tradingeconomics.com/united-states/gdp-per-capita
The date range will only go back to 1960, but you can choose that and "chart" and it will show the graph all the way up until 2015. This is a different source than my first graph, for that one I just found the image and linked it in.
http://www.tradingeconomics.com/united-states/gdp-per-capita
The date range will only go back to 1960, but you can choose that and "chart" and it will show the graph all the way up until 2015. This is a different source than my first graph, for that one I just found the image and linked it in.