Portal Math: Quantifying Oregon’s Transfer Losses
The transfer portal has proven to be huge weapon in the modern landscape of college football. Three of the top 5 transfer classes in 2025 are now in the playoff semi-finals. Ole Miss with the #3 class, Oregon with the #4 class and Miami with the #5 class have all had massive success using the portal to bolster their rosters.
Indiana had the #13 class but they managed to pull the Heisman Trophy winner this last cycle. That’s a win.
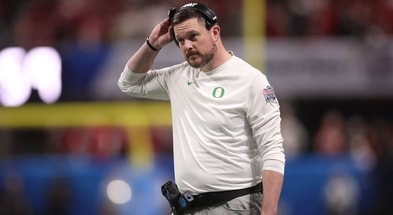
While the transfer portal can be a great way to add key players to your depth chart, the portal works both ways. As Dan Lanning is adding guys he thinks will help him win games, he’s also trying to retain starters and players that have a clear path to playing time.
Oregon has a stellar hit rate on the guys they bring in. How well have they evaluated the ones who left?
What is the Damage to Oregon from the Portal?
Since Dan Lanning joined the team, 80 players have entered the transfer portal. Some of them found new homes, some did not. I’m not counting the players that transferred before Dan coached his first season. These 80 guys played for Lanning and his staff.
The 2025-2026 team has 12 players who have entered the portal or are planning to enter the portal. Those 12 players account for 1,338 total snaps played this season. Some of them on offense (323), some of them on defense (533), and some on special teams (482.)
Oregon played 24,702 total snaps this year across their entire roster. There’s really only a handful of guys who are leaving with significant time played. Kingston Lopa (238), Daylen Austin (309), and Sione Laulea (190) have the most snaps of the bunch.
In all the Ducks are losing about 5% of their total snaps with these 12 players. How does that compare to past years?
| Year | Transfers | Snaps | Team Snaps | Percentage |
| 2025 | 12 | 1338 | 24702 | 5% |
| 2024 | 18 | 801 | 25048 | 3% |
| 2023 | 18 | 1522 | 25433 | 6% |
| 2022 | 32 | 3286 | 24685 | 13% |
The 2022-2023 team lost by far the most players to the portal. Those players also accounted for a significant number of snaps from the total count for the roster. However, if you average out the snaps over the entire number of transfers, this 2025-2026 team is losing the highest number per player.
| Year | AVG Per Transfer |
| 2025 | 111.5 |
| 2024 | 44.5 |
| 2023 | 84.6 |
| 2022 | 102.7 |
This is what is most concerning about the current timeline of the portal. All that experience is walking out the door while the Ducks are in the middle of a playoff run. Could it bite them in the end? Hopefully not.
Which Side of the Ball are the Transfers Coming From?
Initially when some of the players started announcing their intentions to transfer, it seemed like it was almost entirely made up of defensive players. Specifically, a lot of defensive backs. It ended up evening out in the end, and now there are exactly six offensive players and six defensive players in the portal from this team.
Top 10
- 1New
AP Poll Prediction
Big changes on deck for Top 25
- 2
Bracketology
Shake up, new No. 1 seed
- 3Trending
Jacarrius Peak injury
Gamecocks hoping for good news
- 4
Rondale Moore death
Jeff Brohm statement
- 5Hot
Top 16 seeds revealed
March Madness is here
Get the Daily On3 Newsletter in your inbox every morning
By clicking "Subscribe to Newsletter", I agree to On3's Privacy Notice, Terms, and use of my personal information described therein.
How does that compare to previous years under Lanning?
In total, Oregon has lost 6,947 snaps worth of play with their transfers. Of that number, 2,730 were on defense. That’s just under 40% of the snaps. Offense accounts for 2,207 (32%) and 2,010 on special teams (29%). Why is Oregon losing so many defensive players specifically and why so many DBs?
Why so many defensive players? The numbers are actually pretty close. 41 from defense, 36 from offense, and 3 from special teams. The three position groups that have lost the most players is DB with 20, receivers with 11, and linebackers with 11. Oregon has gone through a lot of defensive backs.
How did the Oregon Transfers Do at Their Next School?
When you lose someone, you’re curious how they do at their next destination, right? You want them to do well, but maybe not too well? We love when Lanning and staff hit on a transfer, but it stings just a little bit when we let a good player walk out the door.
Just looking specifically at the year following their transfer from Oregon, here is the breakdown by season of how many snaps the transfer players logged the next season:
| Year | Oregon Snaps | New School | AVG UO | AVG New Team |
| 2025 | 801 | 4151 | 45 | 231 |
| 2024 | 1522 | 5010 | 85 | 278 |
| 2023 | 3286 | 6548 | 103 | 205 |
That 2023 transfer class had by far the most snaps going out the door. It also had the most snaps played on the new teams. With that said, it also had a lot of guys who did not pan out. There were 12 players from those 32 who didn’t register a single snap in 2023. That’s why the snap average was so low at 205.
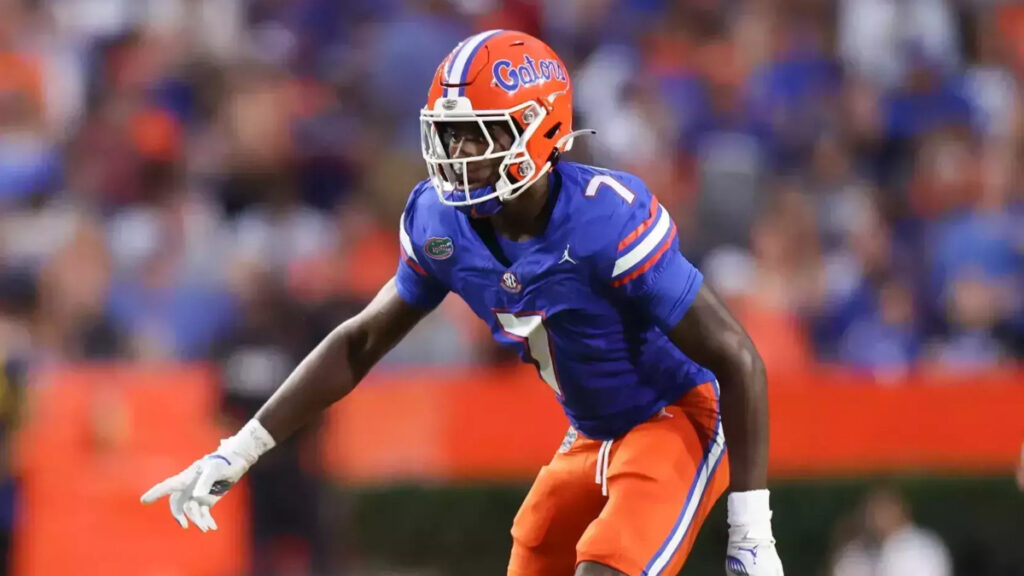
The 2024 class had a lot of talented guys. Trikweze Bridges played over 806 snaps for Florida that season. Bryan Addison logged 800 snaps for UCLA. Kris Hutson had 694 snaps for Arizona and Jake Shipley played 652 for North Texas. In total there were 9 players out of that 18 who played 240 snaps or more in that season.
2025 also had a handful of guys that really did well for other teams. The one that doesn’t really count is Jaron-Keawe Sagapolutele. He only spent a few weeks at Oregon and he logged 907 snaps for Cal. Emar’rion Winston and Tyler Turner combine for over 1,081 snaps for Baylor. Rodrick Pleasant had 672 for UCLA and Khamari Terrell logged 672 for Texas St.
It’s nice to see these guys have success for other schools. Oregon continues to bring in top recruiting classes and top transfer classes, so some guys have to go. That’s the nature of the business.
We hope they succeed wherever they may go…. Just hopefully not against Oregon.