Softball America's Week Five Composite Rankings
Introduction to the Composite Rankings and Statistics
The rankings presented below are independent of the Softball America Top 25. Instead, they combine all major college softball polls into a single average list. As the season progresses, RPI and KPI data will be added to this composite. All rankings reflect games played from Monday to Sunday of the previous week.
In addition, the offensive and pitching/defensive analyses highlight the key metrics that most often predict success. These sections help show how each team performs in the areas that matter most.
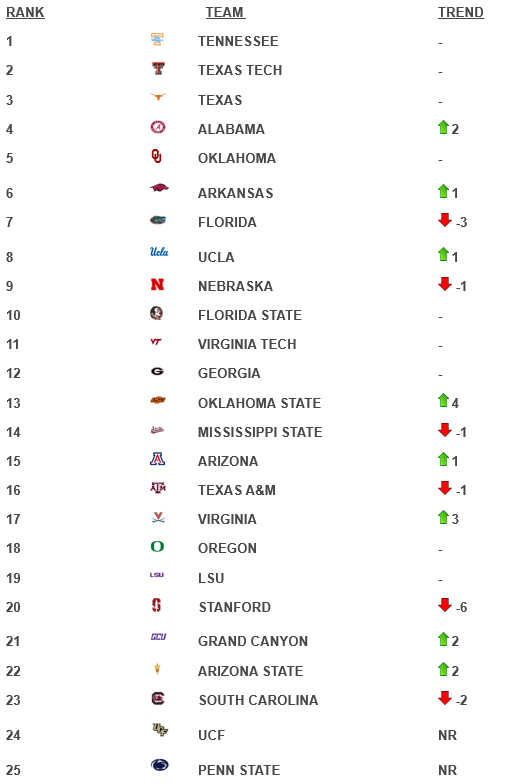
Week Four Composite Rankings
Editor’s note: All statistics were prior to Wednesday’s games
Within the top 10, Alabama continued its upward momentum after posting a perfect 7–0 week, highlighted by two dominant victories over South Florida. Oklahoma State also made a notable move, climbing from No. 17 to No. 13 following a signature win against Nebraska in a thrilling extra‑inning contest. Meanwhile, Virginia rose to No. 17 after securing a pair of impressive wins over Michigan and improving to an outstanding 19–1 start to the season.
Elsewhere, Stanford slipped for the second consecutive week, dropping six spots after opening ACC play with a series loss to Louisville. South Carolina also experienced a slight dip, falling two positions following an upset loss to Marist. Rounding out the movement, the Composite Rankings welcome two new entrants this week, as UCF and Penn State join the field after productive weekends from both programs.
Offensive Analysis
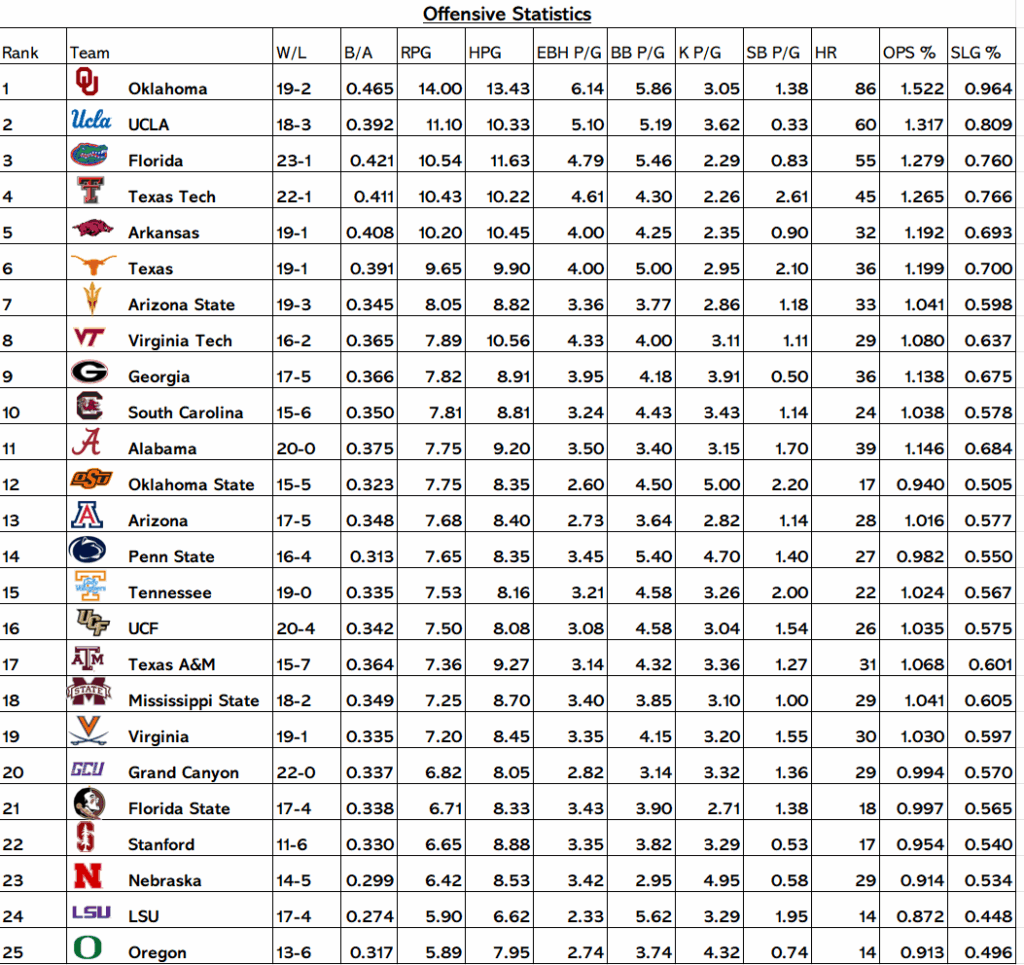
Texas, Arkansas, and the Middle‑Tier Shakeup
One of the most notable shifts came from Arkansas, which slipped from No. 2 in Week Three to No. 5 in Week Four despite strong raw numbers.
- OPS dropped from 1.152 to 1.192 (still strong)
- Runs per game dipped slightly (10.43 → 10.20)
- HR total lagged behind peer programs
Arkansas did not regress as much as others did after passing them, particularly Texas Tech and Texas, whose offensive profiles became more complete in Week Four against lesser competition.
Texas Tech showed one of the most convincing Week‑to‑Week improvements:
- Runs per game increased (9.90 → 10.43)
- HR nearly doubled (29 → 45)
- OPS climbed from 1.200 to 1.265
This jump reflects a lineup finding consistent power without an accompanying spike in strikeouts, with conference play just around the corner, which could be a critical indicator moving forward.
Alabama, Tennessee, and Oklahoma State: Signs of Pressure
Alabama remained in the top 15 but showed modest regression in ranking despite improving win‑loss results.
- OPS declined from 1.185 to 1.146
- Slugging dropped from .718 to .684
While still productive, Alabama’s Week Four profile indicates fewer explosive innings, suggesting tighter margins against stronger pitching.
Tennessee experienced a similar plateau, with minimal gains in run production and only incremental gains in power.
Top 10
- 1
Lou Holtz
Legendary coach passes
- 2
Urban Meyer
Reacts to tampering punishments
- 3
Bruce Pearl
Admits to nepotism with son
- 4Hot
Sun Belt brawl
Ref punched in process
- 5
Arkansas jerseys
Razorbacks reveal sponsor
Get the Daily On3 Newsletter in your inbox every morning
By clicking "Subscribe to Newsletter", I agree to On3's Privacy Notice, Terms, and use of my personal information described therein.
Oklahoma State, meanwhile, slipped from No. 9 to No. 12 as its power output failed to scale with competition:
- OPS fell from .955 to .940
- SLG dropped from .512 to .505
Pitching/Defense Analysis
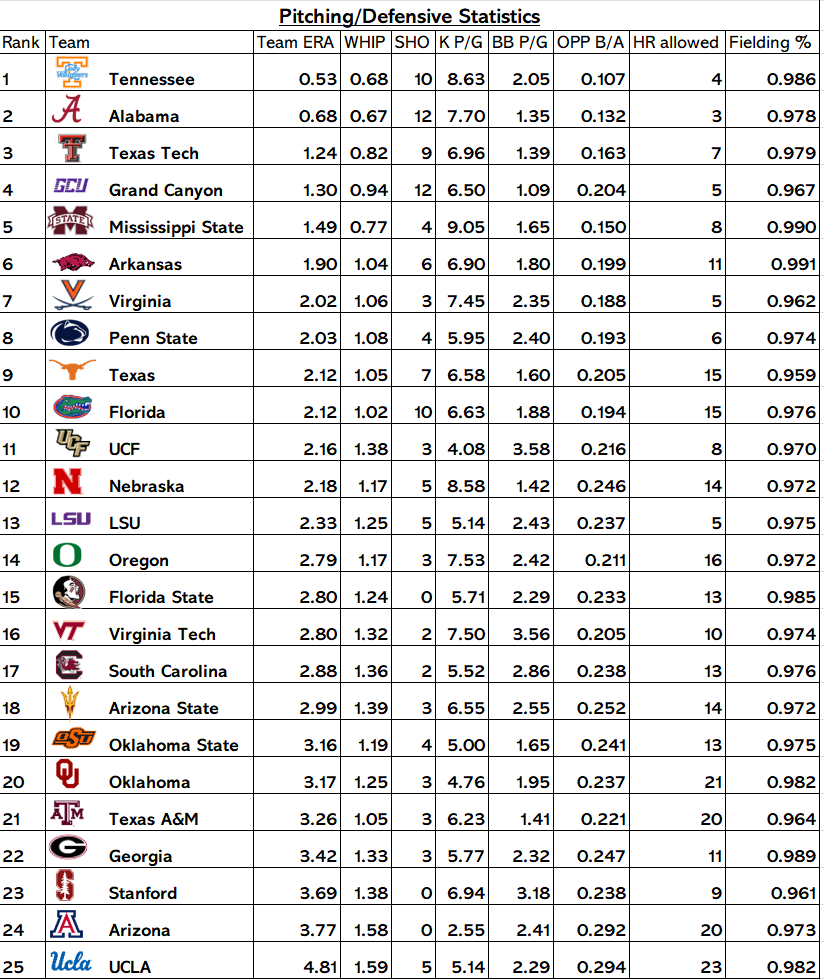
Virginia and Penn State: Quietly Efficient
Virginia continued to trend positively:
- ERA improved (2.25 → 2.02)
- Opponent BA dipped (1.15 → 1.06)
- BB control improved
Meanwhile, Penn State emerged as a notable Week Four riser, debuting at No. 8. While not overpowering, the Nittany Lions’ staff limited damage effectively, relying on contact management and defensive efficiency rather than strikeout volume.
Oklahoma, UCLA, and Late‑Week Exposure
Oklahoma experienced one of the more telling Week‑to‑Week slides, dropping from No. 19 to No. 20:
- ERA remained similar (3.22 → 3.17)
- Opponent BA increased
- HR allowed stayed elevated
The Sooners’ pitching has been serviceable, but Week Four exposed vulnerability to power, particularly concerning with the strength of the conference schedule ahead.
UCLA saw the sharpest regression among ranked teams:
- ERA jumped from 3.99 to 4.81
- Opponent BA rose significantly
- HR allowed increased
This reflects a staff still searching for consistent outs against elite offenses, particularly the second and third times through the order. Oklahoma and UCLA definitely have the offensive firepower to win the National Championship. However, how their depth in the circle emerges will be interesting to follow in conference season.
The Gold Standard Remains: Tennessee and Alabama
Tennessee held the No. 1 ranking in both weeks and further solidified its status as the nation’s most complete pitching staff.
- Team ERA rose slightly (0.32 → 0.53), but remains elite
- Opponent batting average stayed flat (.068 → .068)
- Strikeouts per game remained strong (8.29 → 8.63)
The modest ERA increase reflects volume and competition rather than decline. Tennessee’s ability to suppress contact and limit home runs remains unmatched, and the Week Four data reinforces sustainability rather than early‑season dominance alone.
Alabama mirrored that stability, holding the No. 2 spot with minimal variance:
- ERA improved slightly (0.86 → 0.68)
- Opponent BA held steady (.068 → .067)
- K/9 increased marginally (7.54 → 7.70)
Alabama’s Week Four profile suggests improved efficiency, particularly in high‑leverage innings, with fewer extended at‑bats and tighter run prevention.
Softball America Position Rankings:
Pitcher Rankings
Catcher Rankings
First Base Rankings
Second Base Rankings
Shortstop Rankings
Third Base Rankings
Outfield Rankings
Utility Rankings